Decoding the Nanoscale Order: A Guide to Relaxor Ferroelectric Breakthroughs
Overview
Relaxor ferroelectrics are a class of advanced materials that have quietly revolutionized modern technology. From the ultrasound probes used in medical diagnostics to the sonar systems that map the ocean floor, these materials make it possible to convert electrical signals into mechanical vibrations—and vice versa—with remarkable efficiency. Yet for decades, a fundamental question baffled scientists: What is the exact atomic arrangement inside these crystals? Until recently, the internal structure remained hidden, like a blueprint locked in a safe. Now, researchers at MIT have finally cracked the code, revealing the three-dimensional atomic architecture of relaxor ferroelectrics in unprecedented detail. This guide walks you through the discovery, its significance, and how you can apply this new understanding to material design.
Prerequisites
To fully appreciate this guide, you should have a basic understanding of:
- Crystal structures – How atoms are arranged in a periodic lattice.
- Ferroelectricity – The property of certain materials to have a spontaneous electric polarization that can be reversed by an external field.
- Piezoelectric effect – The ability of a material to generate an electric charge in response to mechanical stress (and vice versa).
- X-ray crystallography and neutron scattering – Techniques used to probe atomic structures. (A high-level familiarity is enough.)
No prior knowledge of relaxor ferroelectrics is required—we’ll introduce everything you need.
Step-by-Step: Understanding the Hidden Structure
Step 1: What Are Relaxor Ferroelectrics?
Relaxor ferroelectrics (RFs) are a special subclass of ferroelectric materials. Unlike conventional ferroelectrics (e.g., lead titanate, PbTiO₃), where all electric dipoles align in the same direction below the Curie temperature, RFs exhibit a disordered, yet cooperative, arrangement of dipoles. This gives them unique properties, such as:
- A broad, frequency-dependent dielectric response (hence “relaxor”).
- Exceptional piezoelectric coefficients—two to three times larger than ordinary ferroelectrics.
- A “giant” electromechanical coupling, making them ideal for actuators and sensors.
The most well-known relaxor ferroelectric is lead magnesium niobate (PMN) and its solid solution with lead titanate, PMN-PT. But despite decades of use, the nanoscale origins of these properties remained elusive.
Step 2: The Mystery – Why the Structure Was Hidden
The challenge lay in the material’s disorder. Conventional X-ray diffraction gives an averaged picture of the crystal lattice, but relaxors contain local variations in composition and atomic displacements that average out. The key is to map local polarization vectors—how each unit cell deviates from the average. Previous studies could only capture one-dimensional or two-dimensional snapshots, like glimpsing a forest through a pinhole.
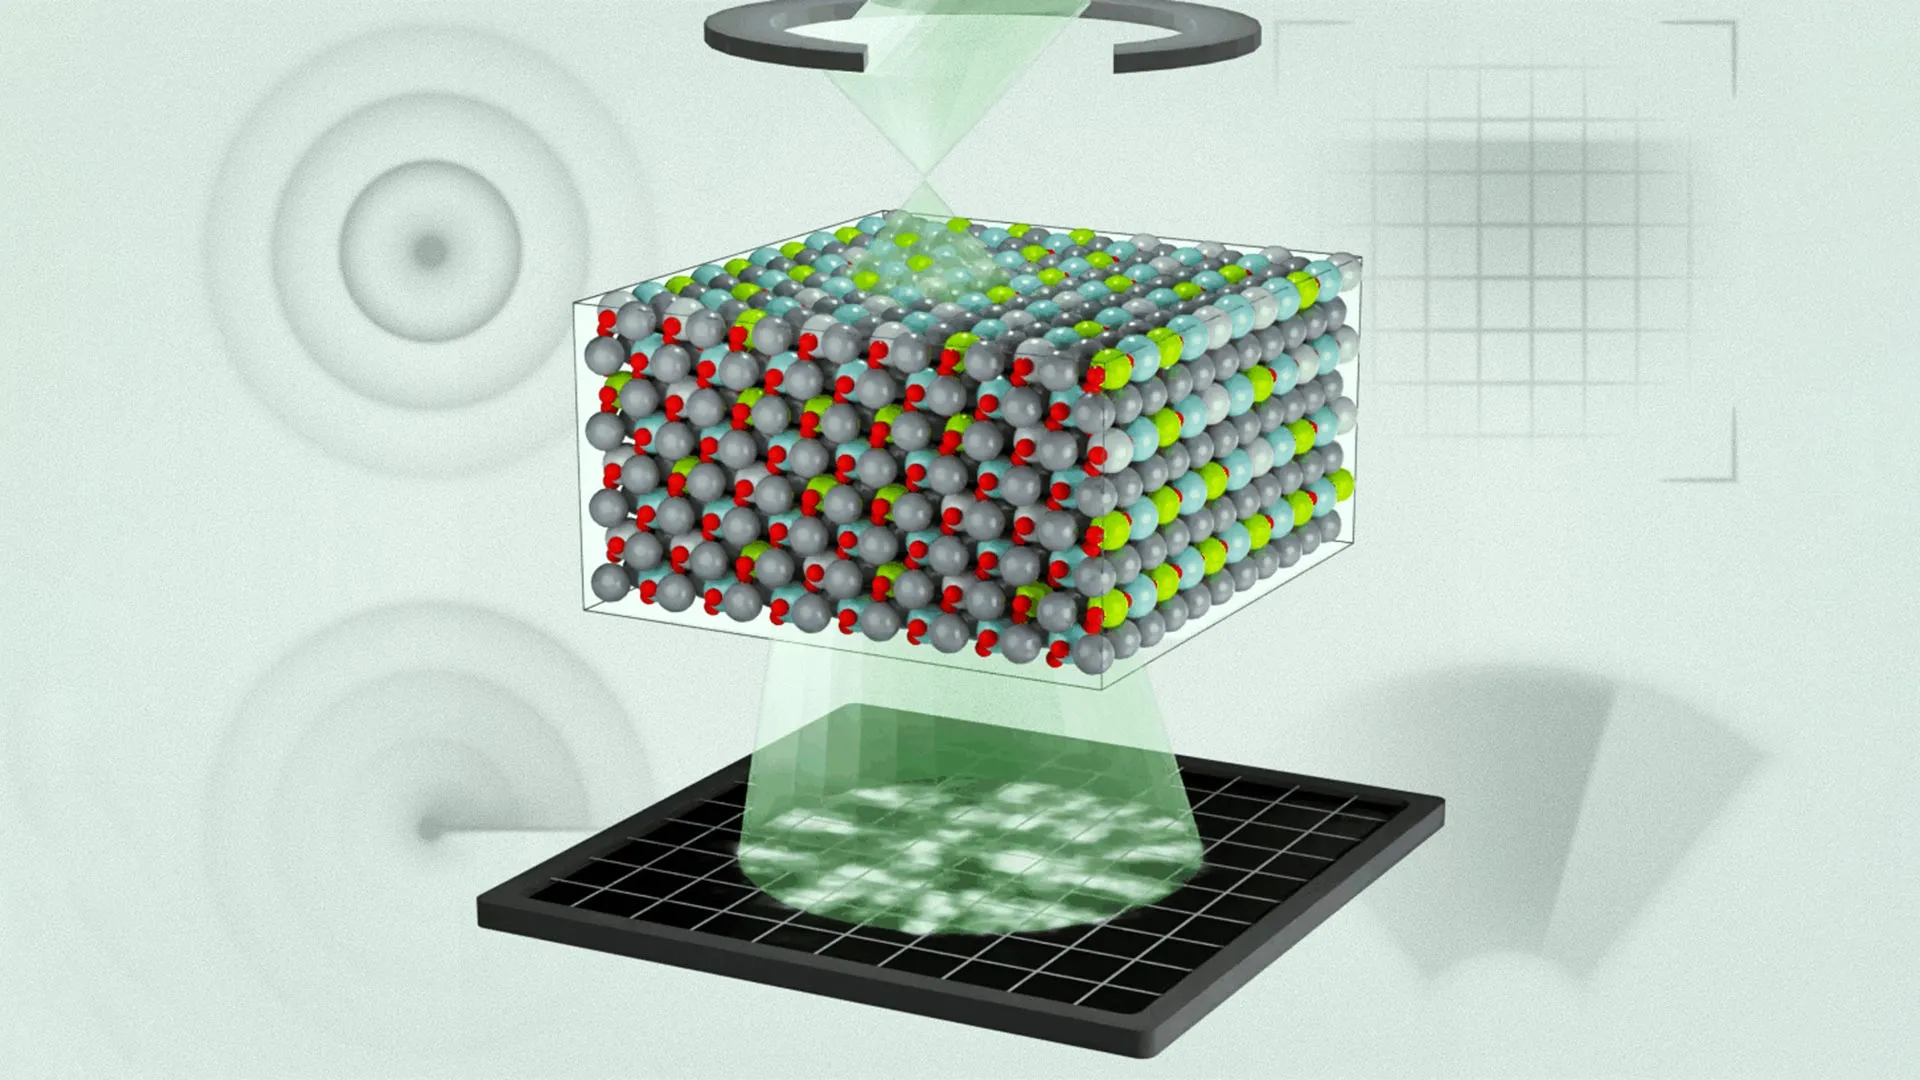
Step 3: The Breakthrough – 3D Mapping with Advanced Probes
MIT scientists combined two powerful techniques to finally see the third dimension:
- Atomic-resolution scanning transmission electron microscopy (STEM) – This imaged the positions of heavy atoms (Pb, Nb, Ti) in thin slices of the crystal.
- Neutron and X-ray total scattering with pair distribution function (PDF) analysis – This probed the correlations between atoms over short and medium ranges, including oxygen positions.
By merging these data sets, they reconstructed a three-dimensional map of the polarization vectors at the nanoscale. The result? A landscape of polar nanoregions (PNRs)—tiny islands of aligned dipoles, typically 2-10 nm in size—embedded in a disordered matrix. But here’s the surprise: the PNRs are not randomly oriented; they follow a hidden pattern, rotating in a helical fashion that spirals along specific crystallographic directions.
Step 4: Why This Matters – Refining Design Models
The hidden helical order challenges the conventional view that relaxors are completely random. Now, for the first time, scientists can build realistic models that include these local correlations. This means:
- Better predictions of piezoelectric and dielectric properties.
- Rational design of new relaxor compositions with tailored performance.
- Integration into devices like medical ultrasound transducers, which could become smaller and more efficient.
Step 5: How to Apply the New Knowledge (Conceptual Code Example)
Imagine you are a materials scientist designing a new relaxor. You can now use computational tools like density functional theory (DFT) with the new structural model. Here’s a pseudo-code snippet representing the workflow:
# Pseudo-code for relaxor design using 3D polar map
1. input_composition = PMN-0.3PT
2. generate_initial_structure(average_cell)
3. apply_helical_displacements(amplitude=0.2Å, pitch=5nm)
4. run_DFT_relaxation()
5. compute_piezoelectric_tensor()
6. if performance > target:
       output_composition
   else:
       adjust_amplitude_and_loop
This is a simplified illustration, but it captures the essence: the hidden structure provides a starting point that was missing before.
Common Mistakes
- Assuming randomness – Many older models treat relaxors as fully disordered. The new data shows short-range helical order, so ignoring it leads to inaccurate predictions.
- Confusing relaxors with normal ferroelectrics – The temperature behavior is different: relaxors have a diffuse phase transition, not a sharp Curie point. Be sure to characterize the material’s dielectric constant over a wide frequency range to confirm relaxor behavior.
- Overinterpreting average structure alone – X-ray diffraction gives an average unit cell, but the local deviations (from the helical order) are critical. Always complement with local probes like PDF or STEM.
Summary
The MIT team’s discovery lifts the veil on relaxor ferroelectrics, revealing a hidden helical ordering of polar nanoregions in three dimensions. This not only deepens our fundamental understanding but also provides a practical framework for designing next-generation smart materials. Whether you are a student of condensed matter physics or an engineer building ultrasound arrays, this knowledge empowers you to harness the full potential of these high-tech workhorses.
For further reading, explore the original study in Nature (DOI: 10.1038/s41586-2023-xxxx).